Offres
Créez rapidement vos devis, analysez vos prix de revient et le bénéfice espéré
2 solutions are available for you to always make the best decision in full knowledge of the facts!
Choose the dashboards that suits you from a list of pre-formatted dashboards
Can’t find a standard report that suits you? No worries, we develop your customised analysis reports according to your requirements and by retrieving data from Hit-Office, our products and even other software. You give us a sample report or choose the data you want to view and we will do the rest!

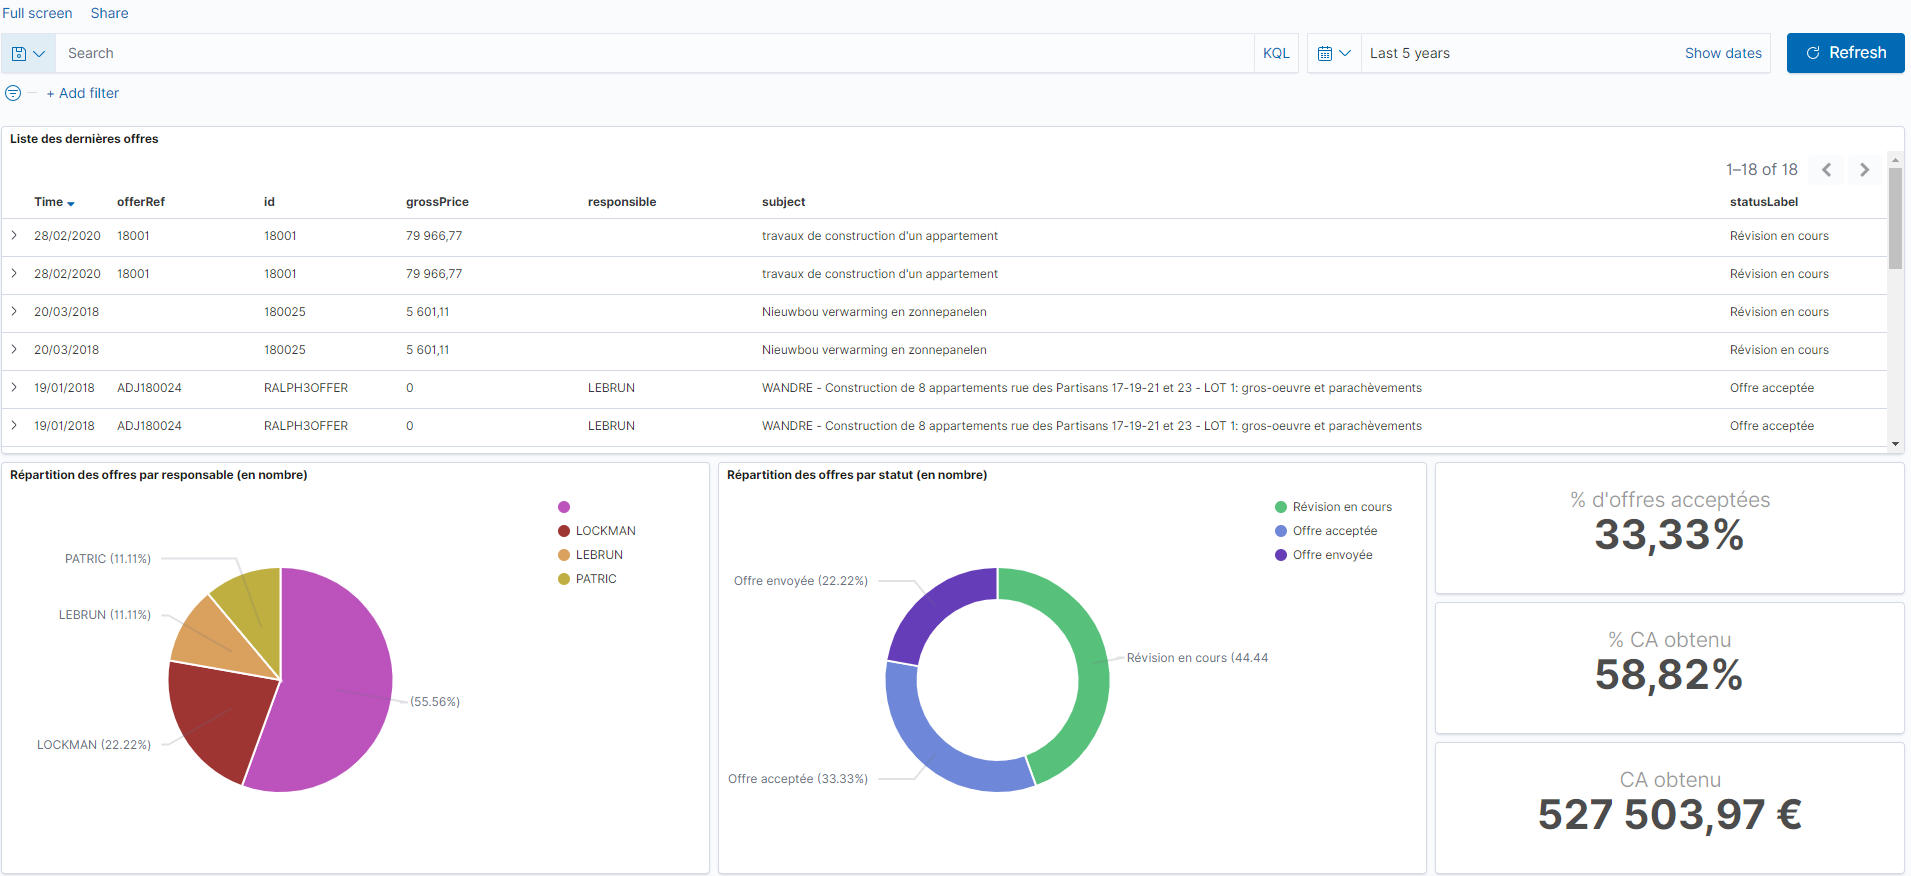
Filter on the period, here the last 5 years
Creating custom filters on fields
Summary list of offers that have been filtered
Example of a customised graphic. We can get more information about the quotations by clicking on a manager. The quotations in point 3 are then filtered.
Second example of a customised graph. We can get more information about the quotations by clicking its status. The quotations in point 3 are then filtered.
Overall summary of price offers (also customised)

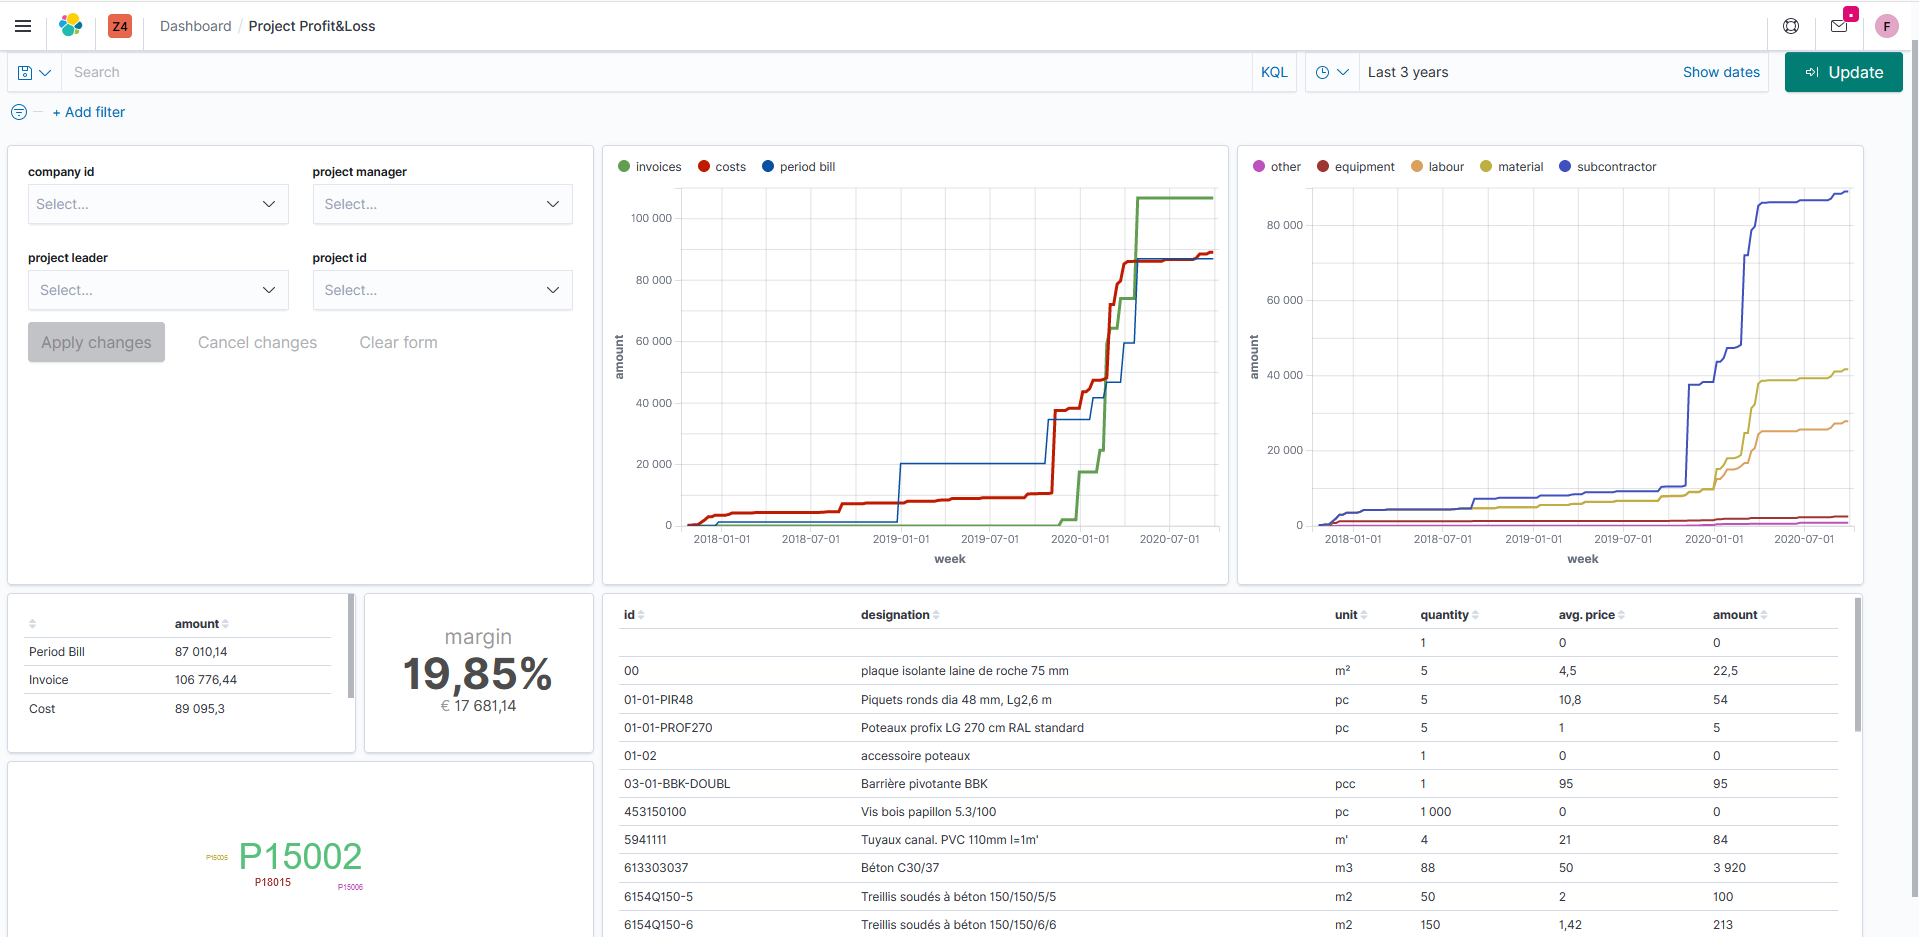
Filter on the period, here the last 3 years
Creating custom filters on fields
Customisable Quick Filters
Example of a customised chart. Here is a global view of site costs, purchases and invoicing over time. We can have more information on an axis by clicking on it. A list of documents is then established for the requested period.
Second example of a customised graph. Here is a global summary of the types of costs (materials, equipment, subcontractors, …). We can have more information on a cost type by clicking on it. The documents are then filtered on the type of cost and the requested period.
Same summary as point 4 but in amounts and not in graphs
Percentage of margin on screened projects
Listing of resources used in the projects with their quantity, purchase price and total amount in euros
Listing of projects and their importance in terms of amounts (the size of the font represents the importance of the project in amounts)